
Page 74 - 18F-FDG PET as biomarker in aggressive lymphoma; technical and clinical validation
P. 74
Chapter 3
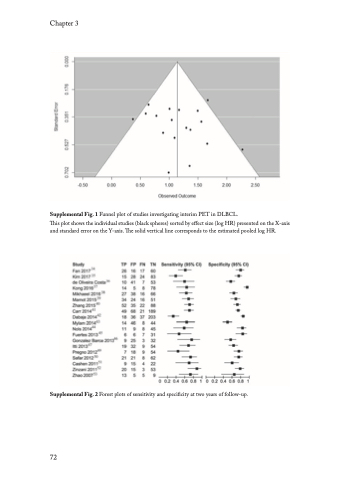
Supplemental Fig. 1 Funnel plot of studies investigating interim PET in DLBCL.
This plot shows the individual studies (black spheres) sorted by effect size (log HR) presented on the X-axis
and standard error on the Y-axis. The solid vertical line corresponds to the estimated pooled log HR.
Supplemental Fig. 2 Forest plots of sensitivity and specificity at two years of follow-up.
72
