
Page 231 - 18F-FDG PET as biomarker in aggressive lymphoma; technical and clinical validation
P. 231
Optimal timing and response criteria of Interim-PET in DLBCL
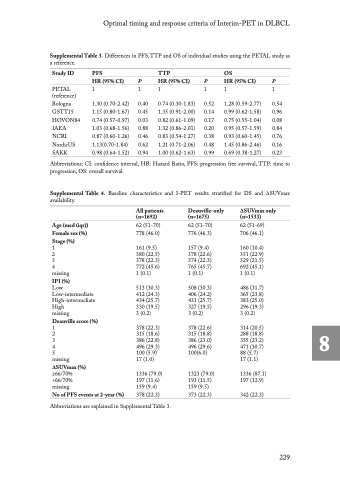
Supplemental Table 3. Differences in PFS, TTP and OS of individual studies using the PETAL study as a reference.
Study ID PFS TTP
HR (95% CI) P HR (95% CI) P
PETAL 1 1 1 1 (reference)
Bologna 1.30 (0.70-2.42) 0.40 0.74 (0.30-1.83) 0.52 GSTT15 1.15 (0.80-1.67) 0.45 1.35 (0.91-2.00) 0.14 HOVON84 0.74 (0.57-0.97) 0.03 0.82 (0.61-1.09) 0.17 IAEA 1.03 (0.68-1.56) 0.88 1.32 (0.86-2.01) 0.20 NCRI 0.87 (0.60-1.26) 0.46 0.83 (0.54-1.27) 0.38 NordicUS 1.13(0.70-1.84) 0.62 1.21 (0.71-2.06) 0.48 SAKK 0.98 (0.64-1.52) 0.94 1.00 (0.62-1.63) 0.99
OS
HR (95% CI) P 1 1
1.28 (0.59-2.77) 0.54 0.99 (0.62-1.58) 0.96 0.75 (0.55-1.04) 0.08 0.95 (0.57-1.59) 0.84 0.93 (0.60-1.45) 0.76 1.45 (0.86-2.46) 0.16 0.69 (0.38-1.27) 0.23
Abbreviations: CI: confidence interval, HR: Hazard Ratio, PFS: progression free survival, TTP: time to progression, OS: overall survival.
Supplemental Table 4. Baseline characteristics and I-PET results stratified for DS and ∆SUVmax availability.
Age (med (iqr))
Female sex (%)
Stage (%)
1
2
3
4 missing
IPI (%)
Low Low-intermediate High-intermediate High
missing
Deauville score (%)
1
2
3
4
5 missing
∆SUVmax (%)
≥66/70% <66/70% missing
All patients (n=1692)
62 (51-70) 778 (46.0)
161 (9.5) 380 (22.5) 378 (22.3) 772 (45.6) 1 (0.1)
513 (30.3) 412 (24.3) 434 (25.7) 330 (19.5) 3 (0.2)
378 (22.3) 315 (18.6) 386 (22.8) 496 (29.3) 100 (5.9) 17 (1.0)
1336 (79.0) 197 (11.6) 159 (9.4)
Deauville-only (n=1675)
62 (51-70) 776 (46.3)
157 (9.4) 378 (22.6) 374 (22.3) 765 (45.7) 1 (0.1)
508 (30.3) 406 (24.2) 431 (25.7) 327 (19.5) 3 (0.2)
378 (22.6) 315 (18.8) 386 (23.0) 496 (29.6) 100(6.0)
1323 (79.0) 193 (11.5) 159 (9.5)
373 (22.3)
∆SUVmax only (n=1533)
62 (51-69) 706 (46.1)
160 (10.4) 351 (22.9) 329 (21.5) 692 (45.1) 1 (0.1)
486 (31.7) 365 (23.8) 383 (25.0) 296 (19.3) 3 (0.2)
314 (20.5) 288 (18.8) 355 (23.2) 471 (30.7) 88 (5.7) 17 (1.1)
1336 (87.1) 197 (12.9)
342 (22.3)
No of PFS events at 2-year (%)
378 (22.3) Abbreviations are explained in Supplemental Table 3.
229
8
