
Page 151 - 18F-FDG PET as biomarker in aggressive lymphoma; technical and clinical validation
P. 151
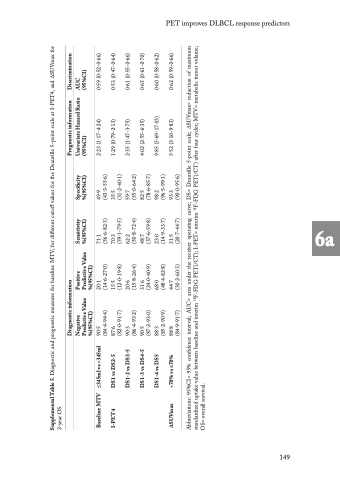
                                PET improves DLBCL response predictors
     0·62 (0·59-0·66) 0·60 (0·58-0·62) 0·65 (0·61-0·70) 0·61 (0·55-0·66) 0·53 (0·47-0·64) 0·59 (0·52-0·66) Discrimination (95%CI) AUC Prognostic information Univariate Hazard Ratio 5·52 (3·10-9·83) 9·85 (5·69-17·03) 4·02 (2·55-6·35) 2·35 (1·47-3·75) 1·29 (0·79-2·13) 2·23 (1·17-4·24) (95%CI) (20·7-44·7) (90·0-95·6) (14·9-33·7) (96·5-99·1) (37·6-59·8) (78·6-85·7) (50·8-72·4) (55·0-64·2) (59·1-79·5) (31·2-40·1) (56·6-82·3) (43·3-55·6) 31·5 93·3 23·0 98·2 48·7 82·5 62·2 59·7 70·3 35·5 71·1 49·9 Supplemental Table 5. Diagnostic and prognostic measures for baseline MTV, for different cutoff values for the Deauville 5-point scale at I-PET4, and ∆SUVmax for Predictive Value (30·2-60·3) (48·4-82·8) (24·0-40·9) (15·8-26·4) (12·0-19·8) (14·6-27·0) %(95%CI) Positive 44·7 68·0 31·6 20·6 15·5 20·1 Diagnostic information Predictive Value Negative %(95%CI) (84·4-94·4) (82·0-91·7) (86·4-93·2) (87·2-93·0) (85·2-90·9) (84·9-91·7)
88·8
88·3
90·5
90·3
87·6
90·5
≤345ml vs >345ml
DS1 vs DS2-5
DS1-2 vs DS3-5
DS1-3 vs DS4-5
DS1-4 vs DS5
>70% vs ≤70%
Baseline MTV
∆SUVmax
2-year OS.
I-PET4
F-FDG PET(/CT); I-PET= interim F-FDG PET(/CT) after four cycles; MTV= metabolic tumor volume; Abbreviations: 95%CI= 95% confidence interval; AUC= area under the receiver operating curve; DS= Deauville 5-point scale; ∆SUVmax= reduction of maximum 18 18 standardized uptake value between baseline and interim
OS= overall survival.
      Specificity %(95%CI)
   Sensitivity %(95%CI)
                       149
 6a
