
Page 115 - 18F-FDG PET as biomarker in aggressive lymphoma; technical and clinical validation
P. 115
Workflow optimization of MTV in DLBCL
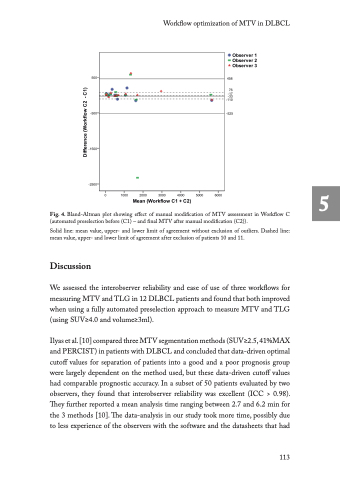
Fig. 4. Bland-Altman plot showing effect of manual modification of MTV assessment in Workflow C (automated preselection before (C1) – and final MTV after manual modification (C2)).
Solid line: mean value, upper- and lower limit of agreement without exclusion of outliers. Dashed line: mean value, upper- and lower limit of agreement after exclusion of patients 10 and 11.
Discussion
We assessed the interobserver reliability and ease of use of three workflows for measuring MTV and TLG in 12 DLBCL patients and found that both improved when using a fully automated preselection approach to measure MTV and TLG (using SUV≥4.0 and volume≥3ml).
Ilyas et al. [10] compared three MTV segmentation methods (SUV≥2.5, 41%MAX and PERCIST) in patients with DLBCL and concluded that data-driven optimal cutoff values for separation of patients into a good and a poor prognosis group were largely dependent on the method used, but these data-driven cutoff values had comparable prognostic accuracy. In a subset of 50 patients evaluated by two observers, they found that interobserver reliability was excellent (ICC > 0.98). They further reported a mean analysis time ranging between 2.7 and 6.2 min for the 3 methods [10]. The data-analysis in our study took more time, possibly due to less experience of the observers with the software and the datasheets that had
113
5
