
Page 46 - Molecular features of low-grade developmental brain tumours
P. 46
2
CHAPTER 2
Results
Samples and clinical features
Fifty-eight SEGAs and one SEN from 58 patients were analyzed (62% male, 36% female; Table 1). Fifty-six patients had a definite clinical diagnosis of TSC, whereas two patients did not show other signs of TSC apart from the tumour. TSC1/TSC2 mutation analysis was performed as part of routine clinical care on blood or tumour DNA for 19 subjects, such that 7 had TSC1 and 12 had TSC2 mutations. For 34 samples we performed TSC1/TSC2 mutation analysis using massively parallel sequencing (MPS); for the remaining 5 samples there was insufficient DNA for this analysis.
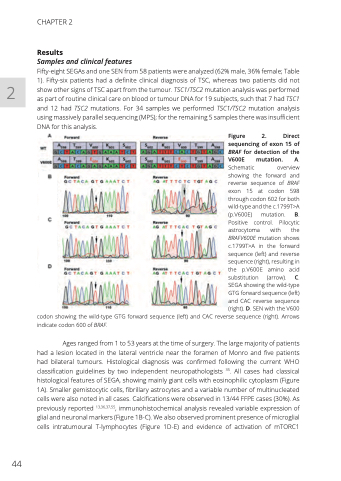
Figure 2. Direct sequencing of exon 15 of BRAF for detection of the V600E mutation. A. Schematic overview showing the forward and reverse sequence of BRAF exon 15 at codon 598 through codon 602 for both wild-type and the c.1799T>A (p.V600E) mutation. B. Positive control. Pilocytic astrocytoma with the BRAFV600E mutation shows c.1799T>A in the forward sequence (left) and reverse sequence (right), resulting in the p.V600E amino acid substitution (arrow). C. SEGA showing the wild-type GTG forward sequence (left) and CAC reverse sequence (right). D. SEN with the V600
codon showing the wild-type GTG forward sequence (left) and CAC reverse sequence (right). Arrows indicate codon 600 of BRAF.
Ages ranged from 1 to 53 years at the time of surgery. The large majority of patients had a lesion located in the lateral ventricle near the foramen of Monro and five patients had bilateral tumours. Histological diagnosis was confirmed following the current WHO classification guidelines by two independent neuropathologists 35. All cases had classical histological features of SEGA, showing mainly giant cells with eosinophilic cytoplasm (Figure 1A). Smaller gemistocytic cells, fibrillary astrocytes and a variable number of multinucleated cells were also noted in all cases. Calcifications were observed in 13/44 FFPE cases (30%). As previously reported 13,36,37,55, immunohistochemical analysis revealed variable expression of glial and neuronal markers (Figure 1B-C). We also observed prominent presence of microglial cells intratumoural T-lymphocytes (Figure 1D-E) and evidence of activation of mTORC1
44
