
Page 102 - Molecular features of low-grade developmental brain tumours
P. 102
4
100
CHAPTER 4
Western blot analysis
Western blot analysis was performed as described previously 67. Equal amounts of proteins (10 μg/lane for cell culture samples or 20 μg/lane for tissue samples) were separated using sodium dodecylsulfate-polyacrylamide gel electrophoresis (SDS-PAGE). Blots were blocked for 1 hour in either 1% BSA or 5% non-fat dry milk in Tris-buffered saline-Tween (TBS-T; 20 mM Tris, 150 mM NaCl, 0.1% Tween 20, pH 7.5). Blots were incubated overnight at 4°C with primary antibodies for LAMTOR1 (1:200 mouse monoclonal, clone SL-1 IIIC4, EMD Millipore, Temecula, CA, USA), ERK1/ERK2 (1:1500 rabbit monoclonal IgG, 9102S, Cell signaling, Danvers, MA), phospho-ERK1/ERK2 (1:1500 rabbit monoclonal IgG, 4370S, Cell signaling, Danvers, MA), S6 (1:1000 rabbit monoclonal IgG, 2217, Cell signaling, Danvers, MA), pS6 (1:1000 rabbit monoclonal IgG, 4857, Cell signaling, Danvers, MA, Cell signaling, Danvers, MA) or β-tubulin (1:30,000 monoclonal mouse, Sigma-Aldrich, Munich, Germany). After washing with TBS-T, blots were incubated for 1 hour with secondary antibodies: goat anti-mouse IgG1 or goat anti-rabbit IgG1 coupled to horseradish peroxidase (both 1:2500; Dako, Glostrup, Denmark). Immunoreactivity was visualized using ECL western blotting detection reagent (GE Healthcare Europe, Diegen, Belgium). Chemiluminescent signal was detected using ImageQuant LAS 4000 analyzer (GE Healthcare, Eindhoven, The Netherlands). Precision Plus Protein Dual Color Standards (Bio-Rad, Richmond, CA, USA) were used to determine the molecular weight of the proteins. Optical density of each band was measured using ImageJ (Adobe Photoshop CS5, San Jose, CA, USA). For each sample the optical density was calculated relative to the optical density of β-tubulin.
Proliferation assay
Proliferation of cell cultures was determined 24 hours after treatment by flow cytometric cell cycle analysis as previously described 62,65. Briefly, 24 hours after treatment cells were suspended in PBS/1% BSA and stained with Fixable Viability Dye eFluor® 780 (eBioscience, San Diego, CA, USA) on ice for 30 minutes. After fixation in 90% ethanol, cells were washed
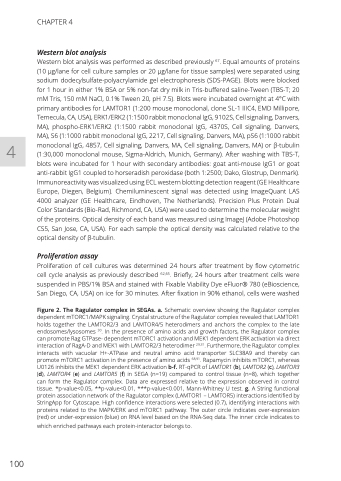
Figure 2. The Ragulator complex in SEGAs. a. Schematic overview showing the Ragulator complex dependent mTORC1/MAPK signaling. Crystal structure of the Ragulator complex revealed that LAMTOR1 holds together the LAMTOR2/3 and LAMTOR4/5 heterodimers and anchors the complex to the late endosomes/lysosomes 30. In the presence of amino acids and growth factors, the Ragulator complex can promote Rag GTPase- dependent mTORC1 activation and MEK1 dependent ERK activation via direct interaction of RagA-D and MEK1 with LAMTOR2/3 heterodimer 29,31. Furthermore, the Ragulator complex interacts with vacuolar H+-ATPase and neutral amino acid transporter SLC38A9 and thereby can promote mTORC1 activation in the presence of amino acids 68,91. Rapamycin inhibits mTORC1, whereas U0126 inhibits the MEK1 dependent ERK activation b-f. RT-qPCR of LAMTOR1 (b), LAMTOR2 (c), LAMTOR3 (d), LAMTOR4 (e) and LAMTOR5 (f) in SEGA (n=19) compared to control tissue (n=8), which together can form the Ragulator complex. Data are expressed relative to the expression observed in control tissue. *p-value<0.05, **p-value<0.01, ***p-value<0.001, Mann-Whitney U test. g. A String functional protein association network of the Ragulator complex (LAMTOR1 – LAMTOR5) interactions identified by StringApp for Cytoscape. High confidence interactions were selected (0.7), identifying interactions with proteins related to the MAPK/ERK and mTORC1 pathway. The outer circle indicates over-expression (red) or under-expression (blue) on RNA level based on the RNA-Seq data. The inner circle indicates to
which enriched pathways each protein-interactor belongs to.
