
Page 94 - Getting of the fence
P. 94
Chapter 4
Table 4.4 Number of approaches addressed by each student
Number of approaches addressed by each student
1 2 3 4 None
All students n = 635 206 282 103 8 36 (33%) (44%) (16%) (1%) (6%)
As Table 4.4 shows, the largest number of students (44%) mentioned two approaches, followed by one approach (33%), and three approaches (16%). A very small percentage of the students (1%) mentioned all four approaches. The sizable minority of 17% who provided answers that fitted into three or more approaches, added to the 44% who mentioned two approaches, means that the majority of students mention multiple approaches when asked about the benefits of EFL literature lessons.
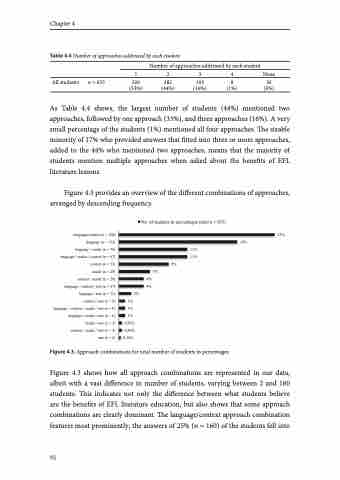
Figure 4.3 provides an overview of the different combinations of approaches, arranged by descending frequency.
Figure 4.3. Approach combinations for total number of students in percentages
Figure 4.3 shows how all approach combinations are represented in our data, albeit with a vast difference in number of students, varying between 2 and 160 students. This indicates not only the difference between what students believe are the benefits of EFL literature education, but also shows that some approach combinations are clearly dominant. The language/context approach combination features most prominently; the answers of 25% (n = 160) of the students fell into
language/context (n = 160) language (n = 122) language / reader (n = 76) language / reader / context (n = 67) context (n = 53) reader (n = 29) context / reader (n = 28) language / context / text (n = 27) language / text (n = 15) context / text (n = 9) language / context / reader / text (n = 8) language / reader / text (n = 6) reader / text (n = 3) context / reader / text (n = 3) text (n = 2)
25%
5% 4%
4% 2%
1% 1% 1% 0,50% 0,50%
0,30%
No. of students in percentages (total n = 635)
11%
11% 8%
19%
92
