
Page 141 - Getting of the fence
P. 141
The relevance and usefulness of the Comprehensive Approach
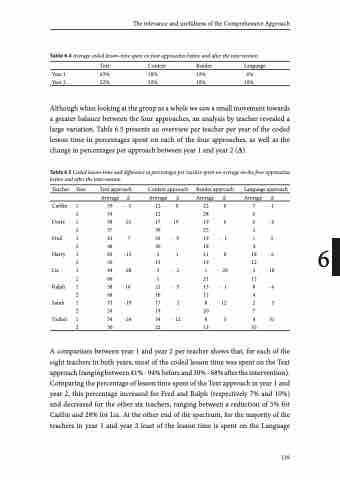
Table 6.4 Average coded lesson-time spent on four approaches before and after the intervention
Text Context Reader Language Year 1 63% 18% 13% 6%
Year 2 52% 19% 19% 10%
Although when looking at the group as a whole we saw a small movement towards a greater balance between the four approaches, an analysis by teacher revealed a large variation. Table 6.5 presents an overview per teacher per year of the coded lesson time in percentages spent on each of the four approaches, as well as the change in percentages per approach between year 1 and year 2 (Δ).
Table 6.5 Coded lesson-time and difference in percentages per teacher spent on average on the four approaches before and after the intervention
Teacher Year Text approach Average Δ Caitlin 1 59-5
Context approach Average Δ
Reader approach Average Δ
22 6 28
19 6 25
19 -1
18 4 6 11 8 18 - 6
19 12
1 20 2 10 21 12
Language approach Average Δ
12 0 2 54 12
7 -1 6
6 -4 2 13
Doris 1 58 -21 17 2 37 36
19
Fred 1 417 2 48
Harry 1 69 -13 2 56
39 -9 30
21 13
Liz 1 94 -28
2 66 1
Ralph 1 58 10 2 68
3-2
21 -5 16
17 2
13 -1 12
8 12 20
85
13 35
Sarah 1 73 -19
2 54 19
8 -4 4 25 7
Ysabel 1 54 -24 34 2 30 22
- 12
4 31
A comparison between year 1 and year 2 per teacher shows that, for each of the eight teachers in both years, most of the coded lesson time was spent on the Text approach (ranging between 41% - 94% before and 30% - 68% after the intervention). Comparing the percentage of lesson time spent of the Text approach in year 1 and year 2, this percentage increased for Fred and Ralph (respectively 7% and 10%) and decreased for the other six teachers, ranging between a reduction of 5% for Caitlin and 28% for Liz. At the other end of the spectrum, for the majority of the teachers in year 1 and year 2 least of the lesson time is spent on the Language
139
