
Page 117 - Getting of the fence
P. 117
Factor
1. Literature
2. Language
3. Personal Development
Items n
9 361 3 360 3 361
Minimum Maximum 1 4
1 4
1 4
M (SD)
2.56 (.584) 3.44 (.613) 2.85 (.642)
Student motivation in the EFL literature lesson
three items (Items 9, 10, and 11), with factor loadings from .511 to .794 and had an eigenvalue of 1.2, explaining 8% of the variance. Because all three items were related to the Reader approach, we named this factor Personal Development.
The Language and the Literature factors formed reliable scales, with highly reliable coefficients of α = .721 and α = .855, respectively. Even though the coefficient for the Personal Development factor (α = .578) can be considered unacceptably low (Cohen et al. 2011), because of its content we do use it in the analysis, realizing we have to be careful in the interpretation of the results with this factor.
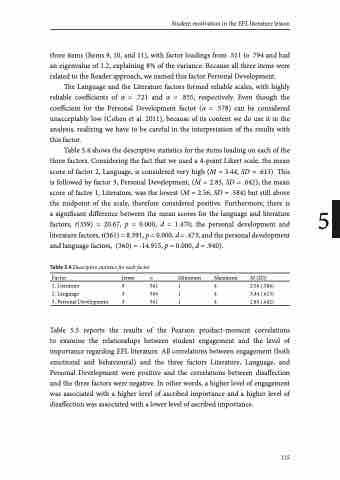
Table 5.4 shows the descriptive statistics for the items loading on each of the
three factors. Considering the fact that we used a 4-point Likert scale, the mean
score of factor 2, Language, is considered very high (M = 3.44, SD = .613). This
is followed by factor 3, Personal Development, (M = 2.85, SD = .642); the mean
score of factor 1, Literature, was the lowest (M = 2.56, SD = .584) but still above
the midpoint of the scale, therefore considered positive. Furthermore, there is 5 a significant difference between the mean scores for the language and literature
factors, t(359) = 20.67, p = 0.000, d = 1.470; the personal development and
literature factors, t(361) = 8.391, p = 0.000, d = .473; and the personal development
and language factors, (360) = -14.915, p = 0.000, d = .940).
Table 5.4 Descriptive statistics for each factor
Table 5.5 reports the results of the Pearson product-moment correlations to examine the relationships between student engagement and the level of importance regarding EFL literature. All correlations between engagement (both emotional and behavioural) and the three factors Literature, Language, and Personal Development were positive and the correlations between disaffection and the three factors were negative. In other words, a higher level of engagement was associated with a higher level of ascribed importance and a higher level of disaffection was associated with a lower level of ascribed importance.
115
