
Page 96 - Never Too Far Away? The Roles of Social Network Sites in Sojourners’ Adjustment
P. 96
Results
Using independent samples t test, it was found that LDRR and GCRR participants showed comparable levels of commitment, relationship satisfaction, and trust. Individuals in GCRR reported more relational certainty, M = 4.04, SD = 0.80, n = 92, than individuals in LDRR, M = 3.80, SD = 0.81, n = 120; t(210) = 2.14, p < 0.05, d = 0.30. To test H1, which predicted that individuals in LDRR have higher levels of SNS use intensity compared to those in GCRR, an independent samples t test confirmed that participants in LDRR have higher levels of Facebook use intensity, M = 5.01, SD = 1.04, n = 139, compared to participants in GCRR, M = 4.55, SD = 1.15, n = 104; t(241) = -3.20, p < 0.01, d = 0.41. H1 was therefore supported (see Table 2).
SNS use in expressing one’s relationship involvement
H2 predicted that individuals in LDRR, more than those in GCRR, express strategic and routine maintenance behaviors on Facebook. Confirming H2, LDRR participants reported higher levels of expressions of strategic maintenance behaviors, M = 3.26, SD = 1.40, n = 135, than GCRR participants, M = 2.53, SD = 1.14, n = 102; t(234) = -4.44, p < 0.001, d = 0.58. Participants in LDRR had higher levels of expression of routine maintenance behaviors, M = 3.00, SD = 1.63, n = 135, than participants in GCRR, M = 2.00, SD = 1.12, n = 102; t(233) = -5.63, p < 0.001, d = 0.74.
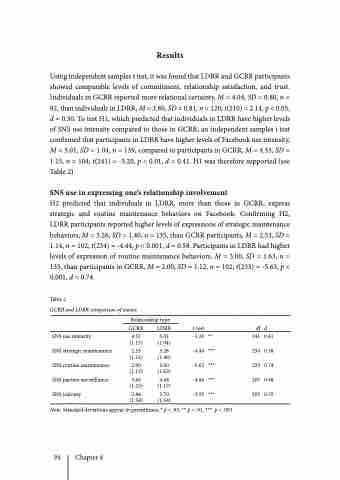
Table 2
GCRR and LDRR comparison of means
Relationship type
t-test
df
d
GCRR
LDRR
SNS use intensity
SNS strategic maintenance SNS routine maintenance SNS partner surveillance SNS jealousy
4.55 5.01 -3.20 ** (1.15) (1.04)
2.53 3.26 -4.44 *** (1.14) (1.40)
2.00 3.00 -5.63 *** (1.12) (1.63)
3.66 4.48 -4.86 *** (1.25) (1.17)
2.84 3.70 -3.95 *** (1.54) (1.54)
241 0.41 234 0.58 233 0.74 207 0.68 205 0.55
Note. Standard deviations appear in parentheses; * p < .05, ** p < .01, *** p < .001
94 Chapter 4
