
Page 47 - Never Too Far Away? The Roles of Social Network Sites in Sojourners’ Adjustment
P. 47
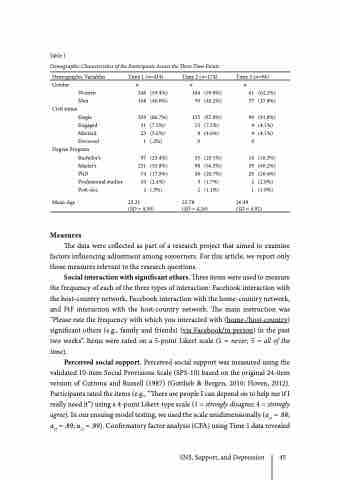
                                Table 1
Demographic Characteristics of the Participants Across the Three Time Points
Gender n n n
  Demographic Variables
   Time 1 (n=414)
    Time 2 (n=174)
   Time 3 (n=98)
 Women 246 Men 168
Single 359 Engaged 31 Married 23 Divorced 1
Degree Program
Bachelor’s 97
Master’s 231 PhD 74 Professional studies 10 Post-doc 2
Mean Age 25.21
Measures
(59.4%) (40.6%)
(86.7%) (7.5%) (5.6%) (.2%)
(23.4%)
(55.8%)
(17.9%)
(2.4%) 3
Civil status
61 37
90 4 4 0
(62.2%) (37.8%)
(91.8%) (4.1%) (4.1%)
(16.3%) (60.2%) (20.4%) (2.0%) (1.0%)
(.5%) (SD = 4.50)
2 (SD = 4.26)
25.78
26.49
104 70
153 13 8 0
(59.8%) (40.2%)
(87.9%) (7.5%) (4.6%)
(20.1%)
(56.3%)
(20.7%)
(1.7%) 2
35 98 36
16 59 20
(1.1%)
1 (SD = 4.92)
 The data were collected as part of a research project that aimed to examine factors influencing adjustment among sojourners. For this article, we report only those measures relevant to the research questions.
Social interaction with significant others. Three items were used to measure the frequency of each of the three types of interaction: Facebook interaction with the host-country network, Facebook interaction with the home-country network, and FtF interaction with the host-country network. The main instruction was “Please rate the frequency with which you interacted with (home-/host-country) significant others (e.g., family and friends) (via Facebook/in person) in the past two weeks”. Items were rated on a 5-point Likert scale (1 = never; 5 = all of the time).
Perceived social support. Perceived social support was measured using the validated 10-item Social Provisions Scale (SPS-10) based on the original 24-item version of Cutrona and Russell (1987) (Gottlieb & Bergen, 2010; Hoven, 2012). Participants rated the items (e.g., “There are people I can depend on to help me if I really need it”) using a 4-point Likert-type scale (1 = strongly disagree; 4 = strongly agree). In our ensuing model testing, we used the scale unidimensionally (αt1 = .88; αt2 = .89; αt2 = .89). Confirmatory factor analysis (CFA) using Time 1 data revealed
  SNS, Support, and Depression 45
