
Page 114 - Never Too Far Away? The Roles of Social Network Sites in Sojourners’ Adjustment
P. 114
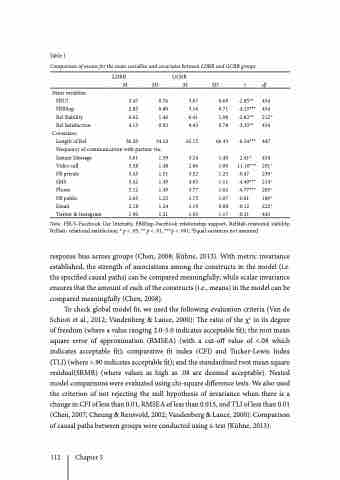
                                Table 1
Comparison of means for the main variables and covariates between LDRR and GCRR groups
       LDRR
M
      SD
   GCRR
M
     SD
    t
    df
 Main variables: FBUI
FBRSup
Rel Stability Rel Satisfaction
Covariates:
Length of Rel
Frequency of communication with partner via:
Instant Message Video call
FB private
SMS
Phone
FB public
Email
Twitter & Instagram
3.61 1.59 3.58 1.48 3.45 1.51 3.42 1.49 3.12 1.49 2.65 1.25 2.18 1.24 1.90 1.21
3.47 0.76 2.85 0.80 6.02 1.46 4.15 0.92
3.67 0.69 3.16 0.71 6.41 1.08 4.43 0.78
65.15 66.43
3.24 1.49 2.06 1.00 3.52 1.23 4.03 1.11 3.77 1.02 2.75 1.07 2.19 0.98 1.93 1.17
-2.85** 454 -4.15*** 454 -2.82** 212 a -3.33** 454
-6.14*** 447
2.41* 454 11.16*** 201 a -0.47 230 a -4.40*** 214 a -4.77*** 203 a -0.81 189 a -0.12 222 a -0.21 443
36.20 34.10
 Note. FBUI–Facebook Use Intensity, FBRSup-Facebook relationship support, RelStab-relational stability, RelSati- relational satisfaction; * p < .05, ** p < .01, ***p < .001; aEqual variances not assumed
response bias across groups (Chen, 2008; Kühne, 2013). With metric invariance established, the strength of associations among the constructs in the model (i.e. the specified causal paths) can be compared meaningfully; while scalar invariance ensures that the amount of each of the constructs (i.e., means) in the model can be compared meaningfully (Chen, 2008).
To check global model fit, we used the following evaluation criteria (Van de Schoot et al., 2012; Vandenberg & Lance, 2000): The ratio of the χ2 to its degree of freedom (where a value ranging 2.0-5.0 indicates acceptable fit); the root mean square error of approximation (RMSEA) (with a cut-off value of <.08 which indicates acceptable fit); comparative fit index (CFI) and Tucker-Lewis Index (TLI) (where >.90 indicates acceptable fit); and the standardized root mean square residual(SRMR) (where values as high as .08 are deemed acceptable). Nested model comparisons were evaluated using chi-square difference tests. We also used the criterion of not rejecting the null hypothesis of invariance when there is a change in CFI of less than 0.01, RMSEA of less than 0.015, and TLI of less than 0.01 (Chen, 2007; Cheung & Rensvold, 2002; Vandenberg & Lance, 2000). Comparison of causal paths between groups were conducted using z-test (Kühne, 2013).
112 Chapter 5
