
Page 54 - Coronary hemodynamics in acute myocardial infarction - Matthijs Bax
P. 54
Chapter 3
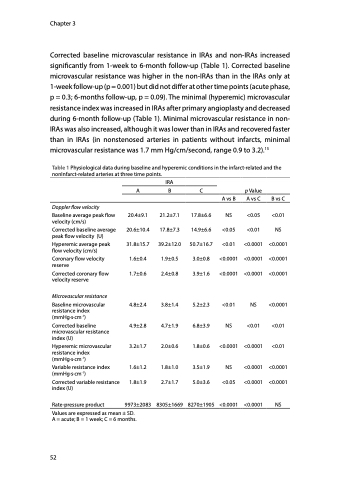
Corrected baseline microvascular resistance in IRAs and non-IRAs increased significantly from 1-week to 6-month follow-up (Table 1). Corrected baseline microvascular resistance was higher in the non-IRAs than in the IRAs only at 1-week follow-up (p = 0.001) but did not differ at other time points (acute phase, p = 0.3; 6-months follow-up, p = 0.09). The minimal (hyperemic) microvascular resistance index was increased in IRAs after primary angioplasty and decreased during 6-month follow-up (Table 1). Minimal microvascular resistance in non- IRAs was also increased, although it was lower than in IRAs and recovered faster than in IRAs (in nonstenosed arteries in patients without infarcts, minimal microvascular resistance was 1.7 mm Hg/cm/second, range 0.9 to 3.2).15
Table 1 Physiological data during baseline and hyperemic conditions in the infarct-related and the nonInfarct-related arteries at three time points.
IRA
A B C pValue
Doppler flow velocity
Baseline average peak flow velocity (cm/s)
Corrected baseline average peak flow velocity (U)
Hyperemic average peak flow velocity (cm/s)
Coronary flow velocity reserve
Corrected coronary flow velocity reserve
Microvascular resistance
Baseline microvascular resistance index (mmHg·s·cm-1)
Corrected baseline microvascular resistance index (U)
Hyperemic microvascular resistance index (mmHg·s·cm-1)
Variable resistance index (mmHg·s·cm-1)
Corrected variable resistance index (U)
Rate-pressure product
20.4±9.1 20.6±10.4 31.8±15.7 1.6±0.4 1.7±0.6
4.8±2.4
4.9±2.8
3.2±1.7
1.6±1.2 1.8±1.9
9973±2083
21.2±7.1
17.8±7.3 39.2±12.0 1.9±0.5 2.4±0.8
3.8±1.4
4.7±1.9
2.0±0.6
1.8±1.0 2.7±1.7
8305±1669
17.8±6.6
14.9±6.6 50.7±16.7 3.0±0.8 3.9±1.6
5.2±2.3
6.8±3.9
1.8±0.6
3.5±1.9 5.0±3.6
8270±1905
A vs B
NS <0.05 <0.01 <0.0001 <0.0001
<0.01
NS
<0.0001
NS <0.05
<0.0001
A vs C
<0.05
<0.01 <0.0001 <0.0001 <0.0001
NS
<0.01
<0.0001
<0.0001 <0.0001
<0.0001
B vs C
<0.01 NS <0.0001 <0.0001 <0.0001
<0.0001
<0.01
<0.01
<0.0001 <0.0001
NS
Values are expressed as mean ± SD. A = acute; B = 1 week; C = 6 months.
52
