
Page 92 - Physical activity in recipients of solid organ transplantation - Edwin J. van Adrichem
P. 92
Chapter 5
Di
erences between organ transplantation groups
After correction for age and gender, additional analysis on di
motivator scores between the organ transplantation groups revealed some minor di
cant higher scores on ‘fear of negative e
transplantation.
e overall between-subject e
the barrier ‘physical limitations’ but contrasts showed no signi
between groups.
erences in barrier and
ects’ compared to kidney transplant
cant mean di
erences
erences
on all of the barrier components and two out of the four motivator components (Table 4).
As an example, contrast showed that kidney transplant recipients of a deceased donor had
signi
recipients of a living donor, recipients of a liver transplantation and recipients of lung
ect of transplant group was signi
cant for
Age and gender were signi
cant covariates in the association between organ type
and ‘fear of negative e
ects’ (
p
= .049 and .030, respectively); female and older recipients
tended to score higher. Age and gender were also signi
with the motivator ‘group activities’ (
p
cant covariates in the association
= .045 and .013, respectively); female and younger
recipients tended to score higher. Age was a signi
‘lack of motivation or time’ (
p =
cant covariate in the association with
.013); younger recipients tended to score higher.
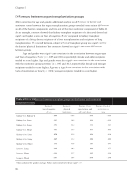
Table 4.
Mean di
component scores
Barrier 1: fear of negative
physical limitations
expectations and self-con dence
Barrier 4: lack of motivation or
time
-.048
-.012 .163 .004 .036 .211 .053 .175 .016
Kidney-l vs. Kidney-d Kidney-l vs. Liver Kidney-l vs. Lung Kidney-l vs. Heart Kidney-d vs. Liver Kidney-d vs. Lung Kidney-d vs. Heart Liver vs. Lung
Liver vs. Heart
e ects
-.173 -.070 -.070 .005 .080 .024 .094 .162 .112 .001 .237 .033 .178 .150 .094 .267 .232 .182 .174 .307 .103 .089 .082 .088
-.004 .157 .009
Lung vs. Heart
erences between transplant groups on the barrier and motivator
-.093
.075
-.079
-.159
Values adjusted for gender and age. Values represented in bold are signi
cant.
90.
Barrier 2: Barrier 3: low
