
Page 140 - Physical activity in recipients of solid organ transplantation - Edwin J. van Adrichem
P. 140
Chapter 7
Table 4.
Intercept 97.4 Age -0.1 Gender (female) 0.6 BMI -0.02 Altitude
96.1; 98.7 <.001 -0.1; -0.0 10 -0.7; 1.8 347 -0.07; 0.04 528
-0.2; 1.7 125 -0.8; 4.5 571 -1.4; 1.1 802
-4.9; -2.9 <.001
-6.8; -5.0 <.001 -11.0; -8.5 <.001 -1.3; -0.4 <.001
0 m. 1000 m. 1400 m. 1640 m. 3515 m. 3900 m. 4680 m.
Time day (PM)
Ref 0.7 0.3
-0.2 -3.9 -5.9 -9.7 -0.8
Tx vs. control
population).
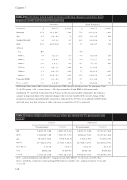
Results linear mixed model on factors predicting change in saturation, heart
frequency, systolic and diastolic blood pressure
e reported β
-0.1
represents the di
Saturation
-1.2; 0.9
BMI, Body Mass Index; SBP, systolic blood pressure; DBP, diastolic blood pressure; Tx, transplant. Total N= 26 (Tx-group n=12 + control group n=14). Age centered at 42 and BMI at 24 (means study
and, with every year that someone is older a decrease in saturation of 0.1% is expected.
p
-value
erence in the outcome variable compared to the reference
-4.0; 10.2
p
-value
786
3.1
372
category (categorical data) or the expected change in the outcome variable with one unit change of that
Table 5.
Median (IQR) capillary blood gas values per altitude for Tx-participants and
β
75.6 -0.03 10.9 0.1
Ref -3.0 -3.0 -0.5
6.8
7.7 18.4 -1.7
68.3; 82.8 <.001 -0.3; 0.2 808 2.9; 19.0 10 -0.2; 0.5 484
-6.7; 0.8 124 -7.7; 1.7 213 -5.5; 4.5 842 2.7; 10.9 1 4.1; 11.2 <.001
13.4; 23.4 <.001 -3.3; -0.0 45
Heart Frequency
parameter (continuous data). Example: saturation is expected to be 9.7% less at an altitude of 4680 meters
Tx-participants
*
Controls
Controls
pH
7.40 (7.38; 7.40)
pCO2
pO2 HCO3- Base Excess SaO2
Lactate
pCO2, carbon dioxide pressure, kPa; pO2, oxygen pressure, kPa; HCO3-, bicarbonate, mmol/L; Base Excess, metabolic component compensating pH deviations, mmol/L; saO2, oxygen saturation, %; Lactate in mmol/L.
5.21 (4.96; 5.49)
23.5 (22.4; 25.3) -1 (-3; 0) 96 (92; 96)
5.54 (5.05; 5.78)
4.83(4.64; 5.12)
22.5 (20.7; 23.5) -2 (-4; -1) 92 (91; 94)
5.43 (5.36; 5.60)
24.2 (23.6; 25.5) -1 (-1; 1) 90 (89; 92)
10.1 (8.8; 11.1) 9.5 (8.9; 10.1)
7.40 (7.38; 7.41)
Tx-participants
7.40 (7.37; 7.40)
7.38 (7.37; 7.40)
8.5 (8.1; 9.1) 7.8 (7.6; 8.5)
1.33 (1.14; 1.74)
25.3 (23.3; 27.6) 0 (-2; 3) 94 (93-95) 1.75 (1.26; 2.12)
0.95 (0.88; 1.15)
1.36 (0.99; 1.43)
138.
Parameter β 95% CI 95% CI
controls
0 meters 1000 meters
