
Page 126 - Physical activity in recipients of solid organ transplantation - Edwin J. van Adrichem
P. 126
Chapter 6
Supplemental information
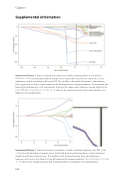
Supplemental Figure 1.
Plot of the coe
from a regression coe
barrier ‘physical limitations’ coe
level of PA. e vertical line re
Statistical learning of explanatory variables predicting physical activity level.
cients path depending on penalty size to statistically learn about the importance of each
explanatory variable in predicting the level of PA.
e variables in the statistical learning
cient of zero farthest to the left represent the strongest predictors. As an example, the
gure deviating
e
cient deviates from zero the earliest and is therefore strongly related to the cts the cut-o value for the penalty parameter that is determined by cross
validation. Tx, transplantation.
Supplemental Figure 2.
coe cients path dependi
ng on penalt variable in predicting sedentary time. on coe cient of zero farthest
regre cut-o
ssi
Statistical learning of explanatory variables predicting sedentary time. Plot of the atory
y si to t
ze to statistically learn about the im e variables in the statistical learning he left represent the strongest predi
p ct
ortance of each explan gure deviating from a ors. e vertical line re
value for the penalty parameter that is determined by cross validation. Tx, transplantation.
ects the
124.
