
Page 114 - Physical activity in recipients of solid organ transplantation - Edwin J. van Adrichem
P. 114
Chapter 6
Male gender (%, [n]) Marital status (%, [n])
Living with partner
Living alone Education level (%, [n])
High
Native Dutch (%, [n]) Employment status (%, [n])
Actively working Not actively working
BMI (kg/m2)
Duration hospital admission (post-tx) in days Discharge destination post-tx (%, [n])
Nursing home
Other hospital
Time since transplantation in months Re-transplantation (%, [n])
Charlson Comorbidity Index (%, [n])
55.2 (327)
77.0 (455) 23.0 (136)
41.9 (248) 31.9 (189) 26.2 (155) 94.6 (560)
35.6 (211) 35.0 (207) 29.4 (174)
94 (545) 5 (30) 1 (7) 0 (1)
10 (62)
32 (192) 51 (300)
56.4 (101)
80.3 (143) 19.7 (35)
36.3 (65) 35.8 (64) 27.9 (50)
97.2 (174)
52.0 (93) 26.3 (47) 21.8 (39)
100 (174) 0 (0) 0 (0) 0 (0)
9 (17)
35 (63) 50 (90)
52.1 (85)
74.2 (121) 25.8 (42)
45.4 (74) 30.1 (49) 24.5 (40)
90.8 (148)
26.4 (43) 38.0 (62) 35.6 (58)
98 (158) 1 (2) 1 (1) 0 (0)
9 (14)
28 (46) 52 (85)
≥3 liv
17 (100) ody ma
15 (26)
20 (32)
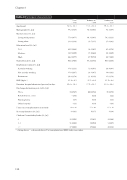
Table 1. Participant characteristics
Age (years)
Low Medium
Retirement
Home Rehabilitation center
0 1-2
Total n=592
56.8 ± 12.1
Kidney-txl n=179
53.3 ± 12.2
Kidney-txd n=163
59.4 ± 11.3
l= ing donor, d = deceased donor. Tx, transplantation; BMI, b
25.4 ± 4.9 29.6 ± 30.4
80 ± 43
ss index.
25.5 ± 4.0 17.9 ± 16.5
75 ± 43
25.9 ± 4.6 23.8 ± 20.6
85 ± 38
112.
