
Page 90 - Like me, or else... - Michelle Achterberg
P. 90
Chapter 4
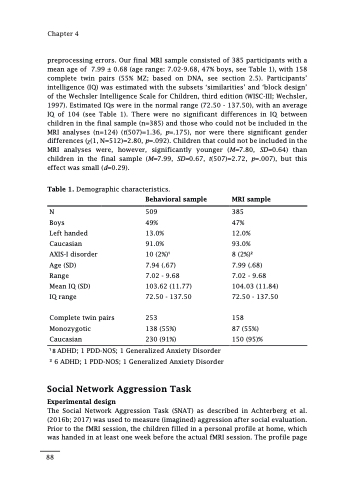
preprocessing errors. Our final MRI sample consisted of 385 participants with a mean age of 7.99 ± 0.68 (age range: 7.02-9.68, 47% boys, see Table 1), with 158 complete twin pairs (55% MZ; based on DNA, see section 2.5). Participants’ intelligence (IQ) was estimated with the subsets ‘similarities’ and ‘block design’ of the Wechsler Intelligence Scale for Children, third edition (WISC-III; Wechsler, 1997). Estimated IQs were in the normal range (72.50 - 137.50), with an average IQ of 104 (see Table 1). There were no significant differences in IQ between children in the final sample (n=385) and those who could not be included in the MRI analyses (n=124) (t(507)=1.36, p=.175), nor were there significant gender differences (χ(1, N=512)=2.80, p=.092). Children that could not be included in the MRI analyses were, however, significantly younger (M=7.80, SD=0.64) than children in the final sample (M=7.99, SD=0.67, t(507)=2.72, p=.007), but this effect was small (d=0.29).
Table 1. Demographic characteristics. Behavioral sample
MRI sample
385
47%
12.0%
93.0%
8 (2%)2
7.99 (.68) 7.02 - 9.68 104.03 (11.84) 72.50 - 137.50
158
87 (55%) 150 (95)%
N
Boys
Left handed Caucasian AXIS-I disorder Age (SD) Range
Mean IQ (SD) IQ range
Complete twin pairs
Monozygotic
Caucasian
1 8 ADHD; 1 PDD-NOS; 1 Generalized Anxiety Disorder 2 6 ADHD; 1 PDD-NOS; 1 Generalized Anxiety Disorder
Social Network Aggression Task
Experimental design
509
49%
13.0%
91.0%
10 (2%)1
7.94 (.67) 7.02 - 9.68 103.62 (11.77) 72.50 - 137.50
253
138 (55%) 230 (91%)
The Social Network Aggression Task (SNAT) as described in Achterberg et al. (2016b; 2017) was used to measure (imagined) aggression after social evaluation. Prior to the fMRI session, the children filled in a personal profile at home, which was handed in at least one week before the actual fMRI session. The profile page
88
