
Page 234 - Like me, or else... - Michelle Achterberg
P. 234
Chapter 8
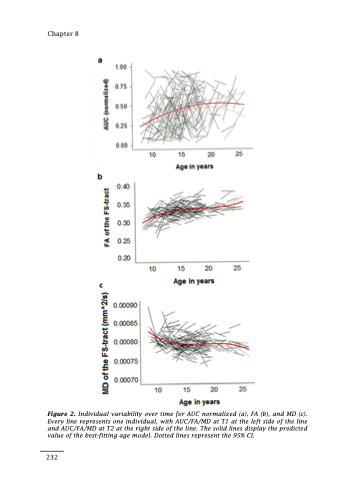
Figure 2. Individual variability over time for AUC normalized (a), FA (b), and MD (c). Every line represents one individual, with AUC/FA/MD at T1 at the left side of the line and AUC/FA/MD at T2 at the right side of the line. The solid lines display the predicted value of the best-fitting age model. Dotted lines represent the 95% CI.
232
