
Page 222 - Like me, or else... - Michelle Achterberg
P. 222
Chapter 7
Supplementary materials
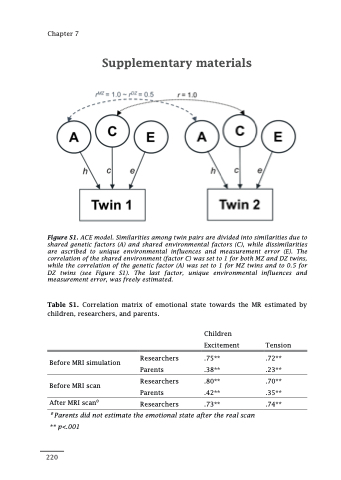
Figure S1. ACE model. Similarities among twin pairs are divided into similarities due to shared genetic factors (A) and shared environmental factors (C), while dissimilarities are ascribed to unique environmental influences and measurement error (E). The correlation of the shared environment (factor C) was set to 1 for both MZ and DZ twins, while the correlation of the genetic factor (A) was set to 1 for MZ twins and to 0.5 for DZ twins (see Figure S1). The last factor, unique environmental influences and measurement error, was freely estimated.
Table S1. Correlation matrix of emotional state towards the MR estimated by children, researchers, and parents.
Before MRI simulation Before MRI scan
Researchers Parents
Researchers Parents
Children
Excitement Tension
.75** .72** .38** .23**
.80** .70** .42** .35**
After MRI scan0
0 Parents did not estimate the emotional state after the real scan ** p<.001
.74**
Researchers .73**
220
