
Page 191 - Like me, or else... - Michelle Achterberg
P. 191
Subcortical-PFC resting state connectivity
189
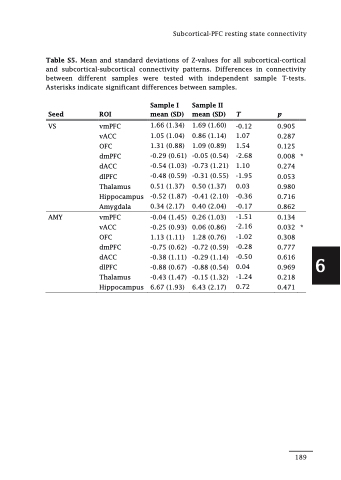
Table S5. Mean and standard deviations of Z-values for all subcortical-cortical and subcortical-subcortical connectivity patterns. Differences in connectivity between different samples were tested with independent sample T-tests. Asterisks indicate significant differences between samples.
Seed ROI
VS vmPFC vACC
OFC
dmPFC
dACC
dlPFC Thalamus Hippocampus Amygdala
AMY vmPFC vACC
OFC
dmPFC
dACC
dlPFC Thalamus Hippocampus
Sample I mean (SD)
1.66 (1.34) 1.05 (1.04) 1.31 (0.88) -0.29 (0.61) -0.54 (1.03) -0.48 (0.59) 0.51 (1.37) -0.52 (1.87) 0.34 (2.17)
-0.04 (1.45) -0.25 (0.93) 1.13 (1.11) -0.75 (0.62) -0.38 (1.11) -0.88 (0.67) -0.43 (1.47) 6.67 (1.93)
Sample II mean (SD) T
1.69 (1.60) -0.12 0.86 (1.14) 1.07 1.09 (0.89) 1.54 -0.05 (0.54) -2.68 -0.73 (1.21) 1.10 -0.31 (0.55) -1.95 0.50 (1.37) 0.03 -0.41 (2.10) -0.36 0.40 (2.04) -0.17
0.26 (1.03) -1.51 0.06 (0.86) -2.16 1.28 (0.76) -1.02 -0.72 (0.59) -0.28 -0.29 (1.14) -0.50 -0.88 (0.54) 0.04 -0.15 (1.32) -1.24 6.43 (2.17) 0.72
p
0.905 0.287 0.125 0.008 * 0.274 0.053 0.980 0.716 0.862
0.134 0.032 * 0.308 0.777 0.616 0.969 0.218 0.471
6
