
Page 187 - Like me, or else... - Michelle Achterberg
P. 187
Subcortical-PFC resting state connectivity
185
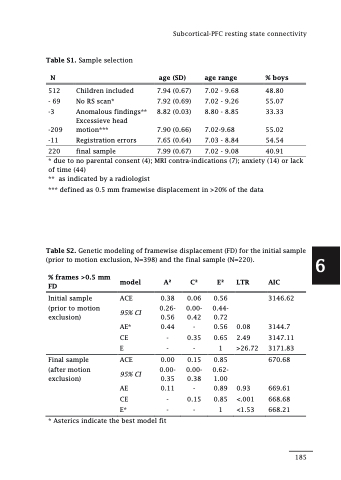
Table S1. Sample selection N
512 - 69 -3
-209 -11
220
* due to
of time (44)
** as indicated by a radiologist
age (SD)
7.94 (0.67) 7.92 (0.69) 8.82 (0.03)
7.90 (0.66) 7.65 (0.64)
7.99 (0.67)
age range
7.02 - 9.68 7.02 - 9.26 8.80 - 8.85
7.02-9.68 7.03 - 8.84
7.02 - 9.08
% boys
48.80 55.07 33.33
55.02 54.54
40.91
Children included No RS scan*
Anomalous findings** Excessieve head motion***
Registration errors
final sample
no parental consent (4); MRI contra-indications (7);
*** defined as 0.5 mm framewise displacement in >20% of the data
Table S2. Genetic modeling of framewise displacement (FD) for the initial sample (prior to motion exclusion, N=398) and the final sample (N=220).
% frames >0.5 mm FD
Initial sample (prior to motion exclusion)
Final sample (after motion exclusion)
model
ACE
95% CI
A2 C2 E2 LTR
0.38 0.06 0.56
0.26- 0.00- 0.44- 0.56 0.42 0.72
AIC
3146.62
3144.7 3147.11 3171.83 670.68
669.61 668.68 668.21
anxiety (14) or lack
AE* 0.44
CE -
E-
ACE 0.00
- 0.56 0.08 0.35 0.65 2.49
-1 >26.72
0.15 0.85 0.00- 0.62-
95% CI 0.00-
0.35 0.38 1.00
AE 0.11 - 0.89 0.93 CE - 0.15 0.85 <.001 E* - - 1 <1.53
* Asterics indicate the best model fit
6
