
Page 153 - Like me, or else... - Michelle Achterberg
P. 153
Longitudinal changes of brain and behavior
151
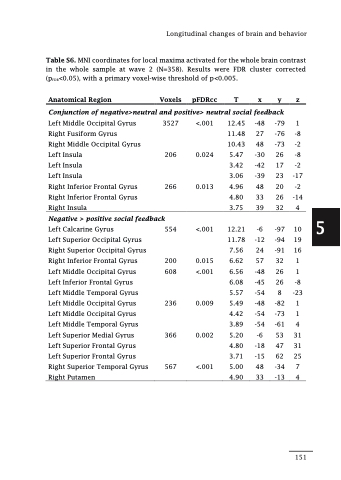
Table S6. MNI coordinates for local maxima activated for the whole brain contrast in the whole sample at wave 2 (N=358). Results were FDR cluster corrected (pFDR<0.05), with a primary voxel-wise threshold of p<0.005.
Anatomical Region Voxels pFDRcc T x y z
Conjunction of negative>neutral and positive> neutral social feedback
Left Middle Occipital Gyrus 3527 Right Fusiform Gyrus
Right Middle Occipital Gyrus
Left Insula 206 Left Insula
Left Insula
Right Inferior Frontal Gyrus 266 Right Inferior Frontal Gyrus
Right Insula
Negative > positive social feedback
Left Calcarine Gyrus 554 Left Superior Occipital Gyrus
Right Superior Occipital Gyrus
Right Inferior Frontal Gyrus 200 Left Middle Occipital Gyrus 608 Left Inferior Frontal Gyrus
Left Middle Temporal Gyrus
Left Middle Occipital Gyrus 236 Left Middle Occipital Gyrus
Left Middle Temporal Gyrus
Left Superior Medial Gyrus 366 Left Superior Frontal Gyrus
Left Superior Frontal Gyrus
Right Superior Temporal Gyrus 567 Right Putamen
<.001 12.45 -48 11.48 27 10.43 48
0.024 5.47 -30 3.42 -42 3.06 -39
0.013 4.96 48 4.80 33 3.75 39
<.001 12.21 -6 11.78 -12 7.56 24
0.015 6.62 57 <.001 6.56 -48 6.08 -45 5.57 -54 0.009 5.49 -48 4.42 -54 3.89 -54
0.002 5.20 -6 4.80 -18 3.71 -15
<.001 5.00 48 4.90 33
-79 1 -76 -8 -73 -2 26 -8 17 -2
23 -17 20 -2 26 -14 32 4
-97 10 -94 19 -91 16 32 1 26 1 26 -8
8 -23 -82 1 -73 1 -61 4
53 31 47 31 62 25
-34 7 -13 4
5
