
Page 149 - Like me, or else... - Michelle Achterberg
P. 149
Longitudinal changes of brain and behavior
147
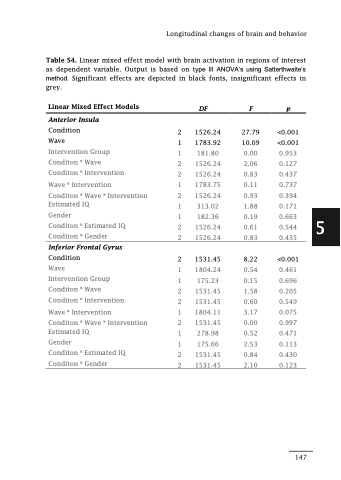
Table S4. Linear mixed effect model with brain activation in regions of interest as dependent variable. Output is based on type III ANOVA’s using Satterthwaite’s method. Significant effects are depicted in black fonts, insignificant effects in grey.
Linear Mixed Effect Models
Anterior Insula
Condition
Wave
Intervention Group
Conditon ˟ Wave
Conditon ˟ Intervention
Wave ˟ Intervention
Conditon ˟ Wave ˟ Intervention Estimated IQ
Gender
Conditon ˟ Estimated IQ
Conditon ˟ Gender
Inferior Frontal Gyrus
Condition
Wave
Intervention Group
Conditon ˟ Wave
Conditon ˟ Intervention
Wave ˟ Intervention
Conditon ˟ Wave ˟ Intervention Estimated IQ
Gender
Conditon ˟ Estimated IQ Conditon ˟ Gender
DF F p
2 1526.24 27.79 1 1783.92 10.09 1 181.80 0.00 2 1526.24 2.06 2 1526.24 0.83 1 1783.75 0.11 2 1526.24 0.93 1 313.02 1.88 1 182.36 0.19 2 1526.24 0.61 2 1526.24 0.83
2 1531.45 8.22
1 1804.24 0.54 1 175.23 0.15 2 1531.45 1.58 2 1531.45 0.60 1 1804.11 3.17 2 1531.45 0.00 1 278.98 0.52 1 175.66 2.53 2 1531.45 0.84 2 1531.45 2.10
<0.001 <0.001 0.953 0.127 0.437 0.737 0.394 0.171 0.663 0.544 0.435
<0.001
0.461 0.696 0.205 0.549 0.075 0.997 0.471 0.113 0.430 0.123
5
