
Page 133 - Like me, or else... - Michelle Achterberg
P. 133
Longitudinal changes of brain and behavior
131
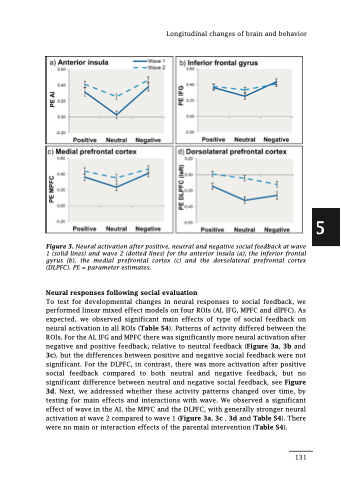
Figure 3. Neural activation after positive, neutral and negative social feedback at wave 1 (solid lines) and wave 2 (dotted lines) for the anterior insula (a), the inferior frontal gyrus (b), the medial prefrontal cortex (c) and the dorsolateral prefrontal cortex (DLPFC). PE = parameter estimates.
Neural responses following social evaluation
To test for developmental changes in neural responses to social feedback, we performed linear mixed effect models on four ROIs (AI, IFG, MPFC and dlPFC). As expected, we observed significant main effects of type of social feedback on neural activation in all ROIs (Table S4). Patterns of activity differed between the ROIs. For the AI, IFG and MPFC there was significantly more neural activation after negative and positive feedback, relative to neutral feedback (Figure 3a, 3b and 3c), but the differences between positive and negative social feedback were not significant. For the DLPFC, in contrast, there was more activation after positive social feedback compared to both neutral and negative feedback, but no significant difference between neutral and negative social feedback, see Figure 3d. Next, we addressed whether these activity patterns changed over time, by testing for main effects and interactions with wave. We observed a significant effect of wave in the AI, the MPFC and the DLPFC, with generally stronger neural activation at wave 2 compared to wave 1 (Figure 3a, 3c , 3d and Table S4). There were no main or interaction effects of the parental intervention (Table S4).
5
