
Page 128 - ADULT-ONSET ASTHMA PREDICTORS OF CLINICAL COURSE AND SEVERITY
P. 128
ADULT-ONSET ASTHMA – PREDICTORS OF CLINICAL COURSE AND SEVERITY
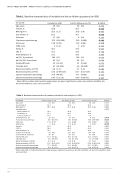
Table 1. Baseline characteristics of included and lost-to-follow-up patients (n=200)
p-value 0.925 0.030 0.062 0.026 0.205 0.049 0.478 0.422 0.602 0.736 0.856 0.975 0.664 0.653 0.872 0.685 0.255 0.474 0.367
Co-variate
Age, years
Female, % 50.8 66.7
Included (n=128) Lost-to-follow-up (n=72) 48 (15) 48 (15)
BMI, kg/m^2 28.3 (5.2)
(ex)-smoker, % 62.2 45.7
Pack year 11 (14)
Fluticasone equivalent μg 375 (250-500)
ACQ score 1.29 (0.92)
GINA score 3 (2-4)
Atopy, % 46.1 42.3 CRS, % 55.2 52.5 Nasal polyposis, % 19.2 20.3
pb FEV1 % predicted 100 (17)
pb FEV1/FVC % predicted 95 (11) Exhaled NO, ppb 20 (13-45) Total IgE, Ku/L 61 (26-199) Blood neutrophils, x10^9/L 3.8 (1.4)
Blood eosinophils, x10^9/L 0.16 (0.09-0.25) Sputum neutrophils percentage 70.8 (48-85) Sputum eosinophils percentage 0.45 (0.1-2.6)
8 (14) 250 (0-500)
1.39 (0.96) 3 (2-4)
100 (17)
96 (11)
22 (13-40) 60 (26-239)
3.7 (1.5)
0.17 (0.11-0.29) 74.7 (54-83) 0.90 (0.28-4.3)
26.8 (5.4)
Mean (SD) or median (interquartile range) values are given. Significant p-values are printed in boldface. pb: post-bronchodilator. ppb: parts per billion.
Table 2. Baseline characteristics of patients included in the analysis (n=128).
Co-variate Deterioration (n=17)
No change (n=58) 50 (16)
48.3
27.2 (4.5)
Improvement (n=53) p-value
Age, years 50 Sex, female, % 41.2 BMI, kg/m^2 28.7 Smoking status
Never smoker, % 35.3 Ex-smoker, % 47.1 Current smoker, % 17.6
Smoking history, py 20 Fluticasone equivalent μg 250 ACQ score 1.15 GINA score 2 Atopy,% 41.2 CRS, % 58.8 Nasal polyposis, % 23.5 pb FEV1 % predicted 93 pb FEV1/FVC % predicted 90 Exhaled NO, ppb 17.4 Total IgE, Ku/L 125 Blood neutrophils, x10^9/L 4.2 Blood eosinophils, x10^9/L 0.17 Sputum neutrophils percentage 77.3 Sputum eosinophils percentage 0.4 Mean values (SD) or median (interquartile range) parts per billion.
(13) (4.4)
(21) (62-250) (0.77) (2-3)
(18)
(9)
(14-44) (19-497) (1.7) (0.07-0.21) (59-89) (0.1-1.3)
46 56.6 29.4
(14) 0.375 0.474 (5.8) 0.086 0.078
(12) 0.014 (250-500) <0.001 (0.86) 0.066 (3-4) <0.001
45.3 50.9 3.8 8 500 1.52 3 45.3 48.3 62.0 20.7 16.0 101 (18) 102 96 (11) 97 19.6 (13-43) 22.2 60 (25-170) 51 3.8 (1.3) 3.7 0.16 (0.09-0.25) 0.16 71,0 (48-84) 62.7 0.4 (0.1-2.3) 0.6
32.8 55.2 12.1
10 (13) 250 (0-500)
1.13 (0.98) 2.5 (2-3)
48.3
0.865 0.341 0.734 0.145 0.086 0.862 0.285 0.369 0.800 0.302 0.426
are given. Significant p-values are printed in boldface. pb:
(16)
(10)
(13-45)
(27-168)
(1.3)
(0.09-0.29)
(47-80)
(0.2-6.2) post-bronchodilator. ppb:
126
