
Page 120 - Timeliness of Infectious Disease Notification & Response Systems - Corien Swaan
P. 120
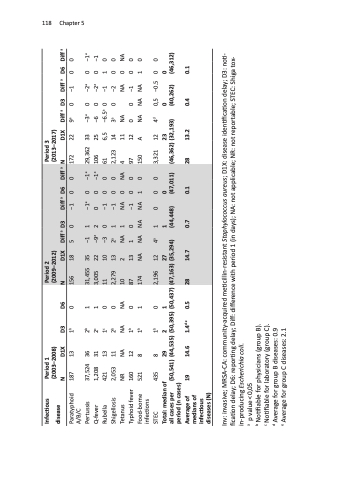
118 Chapter 5
                        Infectious disease
Period 1 (2003–2008)
Period 2 (2009–2012)
Period 3 (2013–2017)
Paratyphoid A/B/C
187 13
1b 0
156 18
5
0 −1
0 −2a 0 −1a
Pertussis
37,524 36 1,208 31 421 13 2,053 11 NR NA 160 12 521 8
2b 1 2c 1 1c 0 2b 0 NA NA 1b 0 1b 1
31,455 35 3,005 22 11 10 2,279 13 10 2 87 13 174 NA
−1 −9a −3 2a NA 1 NA
1 −1a 0 −1a 29,362 2 00−1a106
0 −10061
1 −1002,123 1 NA0NA4
33 −3a 25 −6 6,5 −6.5a 14 3a
Q-fever
0 −2a 0 −1 0 −2
0 −1 10 00 0 NA 00 10
Rubella
Shigellosis
Tetanus
11 NA 12 0 A NA
NA 0 −1 NA NA
Typhoid fever
0 −10097 NA NA 1 0 150
Food-borne infections
STEC
435 8
1b 0
2,196 12
4a
1 0 0 0 3,321 12 4d
0,5 −0.5
00
Total: median of 29
2 1 (50,395) (50,437)
27 (47,163) (35,294)
1 0 (44,448) (47,011)
23 (46,362) (32,193)
0 0 (40,262) (46,312)
all cases per period (n cases)
(50,541) (44,535) 19 14.6
Average of medians of infectious diseases (N)
1.4d e 0.5 28 14.7
0.7 0.1
28 13.2 0.4 0.1
N D1X
D3 D6
N D1X Diffa D3
Diffa D6 Diffa N
D1X Diffa D3
Diff a
D6 Diffa
Inv: invasive; MRSA-CA: community-acquired meticillin-resistant Staphylococcus aureus; D1X: disease identification delay; D3: noti- fication delay; D6: reporting delay; Diff: difference with period 1 (in days); NA: not applicable; NR: not reportable; STEC: Shiga tox- in-producing Escherichia coli.
a p value < 0,05
b Notifiable for physicians (group B).
c Notifiable for laboratory (group C).
d Average for group B diseases: 0.9
e Average for group C diseases: 2.1
0 −100172
22 9a
00
