
Page 91 - Assessing right ventricular function and the pulmonary circulation in pulmonary hypertension Onno Anthonius Spruijt
P. 91
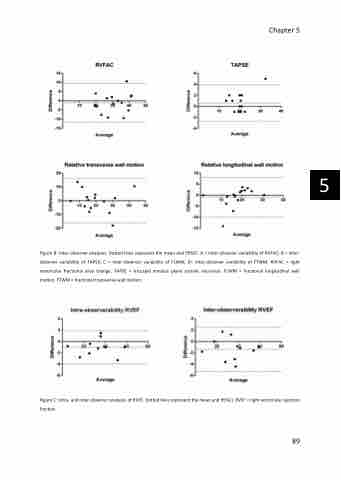
Figure B: Inter-observer analyses. Dotted lines represent the mean and 95%CI. A = inter-observer variability of RVFAC; B = inter- observer variability of TAPSE; C = inter-observer variability of FLWM; D= inter-observer variability of FTWM. RVFAC = right ventricular fractional area change. TAPSE = tricuspid annulus plane systolic excursion. FLWM = fractional longitudinal wall motion. FTWM = fractional transverse wall motion.
Figure C: Intra- and inter-observer analyses of RVEF. Dotted lines represent the mean and 95%CI. RVEF = right ventricular ejection fraction.
Chapter 5
   89
5
