
Page 140 - DISINVESTMENT AND IMPLEMENTATION OF VISION SCREENING TESTS BASED ON THEIR EFFECTIVENESS
P. 140
CHAPTER 7
138
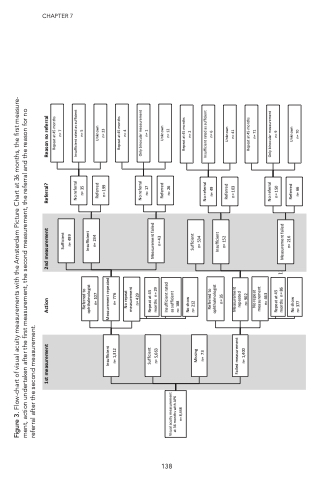
Figure 3. Flow-chart of visual acuity measurements with the Amsterdam Picture Chart at 36 months, the first measure- ment, action undertaken after the first measurement, the second measurement, the referral and the reason for no
Figure 3: Flow-chart of visual acuity measurements with the Amsterdam Picture Chart at 36 months, the first measurement, action undertaken after the first measurement, referral after the second measurement.
the second measurement, the referral and the reason for no referral after the second measurement.
Visual acuity measurement at 36 months with APK
Insufficient rated as sufficient
n= 188
Referred n= 26
Unknown n= 12
n= 8,448
Repeat at 45 months n= 2
1st measurement
Action
2nd measurement
Referral?
Reason no referral
Insufficient n= 1,312
Measurement repeated n= 776
Repeat at 45 months n= 4
Sufficient n= 5,663
Repeat at 45 months n= 29
Measurement failed n= 43
Missing n= 73
No show n= 212
Sufficient n= 534
Failed measurement n= 1,400
Measurement repeated
Referred to ophthalmologist
No referral n= 35
Insufficient rated as sufficient n= 5
n= 107
Insufficient n= 234
Referred n= 199
Unknown n= 23
No repeat measurement
n= 429
No referral n= 17
Only binocular measurement n= 1
Referred to ophthalmologist
No referral n= 49
Insufficient rated as sufficient n= 6
n= 35
Insufficient n= 152
Referred n= 103
Unknown n= 41
n= 902
Repeat at 45 months n= 71
No repeat measurement
n= 463
No referral n= 150
Only binocular measurement n= 9
Repeat at 45 months n= 86
127 Measurement failed n= 216
No show n= 377
Referred n= 66
Unknown n= 70
Sufficient n= 499
Repeat at 45 months n= 7
