
Page 99 - Emotions through the eyes of our closest living relatives- Exploring attentional and behavioral mechanisms
P. 99
3 (Species*Emotion Category)
Bonobo
Human
Distress 0.54 0.51 – 0.58 0.96
Yawn 0.50 0.46 – 0.54 0.51 Groom 0.49 0.45 – 0.53 0.61 Sex 0.54 0.50 – 0.57 0.93 Play 0.49 0.46 – 0.53 0.61 Distress 0.53 0.48 – 0.56 0.85 Yawn 0.47 0.43 – 0.51 0.91 Groom 0.49 0.45 – 0.53 0.73
Emotions hold the attention of bonobos and humans
Results
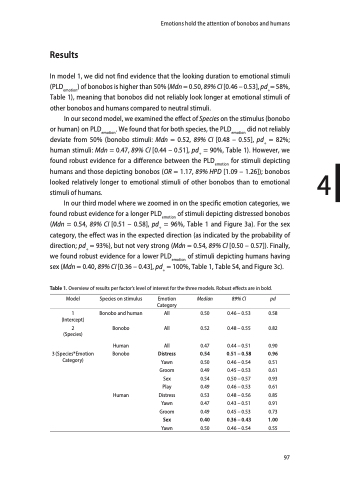
In model 1, we did not find evidence that the looking duration to emotional stimuli (PLDemotion) of bonobos is higher than 50% (Mdn = 0.50, 89% CI [0.46 – 0.53], pd+= 58%, Table 1), meaning that bonobos did not reliably look longer at emotional stimuli of other bonobos and humans compared to neutral stimuli.
In our second model, we examined the effect of Species on the stimulus (bonobo
or human) on PLDemotion. We found that for both species, the PLDemotion did not reliably
deviate from 50% (bonobo stimuli: Mdn = 0.52, 89% CI [0.48 – 0.55], pd+ = 82%;
human stimuli: Mdn = 0.47, 89% CI [0.44 – 0.51], pd+ = 90%, Table 1). However, we
found robust evidence for a difference between the PLDemotion for stimuli depicting
humans and those depicting bonobos (OR = 1.17, 89% HPD [1.09 – 1.26]); bonobos 4 looked relatively longer to emotional stimuli of other bonobos than to emotional
stimuli of humans.
In our third model where we zoomed in on the specific emotion categories, we found robust evidence for a longer PLDemotion of stimuli depicting distressed bonobos (Mdn = 0.54, 89% CI [0.51 – 0.58], pd+ = 96%, Table 1 and Figure 3a). For the sex category, the effect was in the expected direction (as indicated by the probability of direction; pd+ = 93%), but not very strong (Mdn = 0.54, 89% CI [0.50 – 0.57]). Finally, we found robust evidence for a lower PLDemotion of stimuli depicting humans having sex (Mdn = 0.40, 89% CI [0.36 – 0.43], pd+ = 100%, Table 1, Table S4, and Figure 3c).
Table 1. Overview of results per factor’s level of interest for the three models. Robust effects are in bold.
Model Species on stimulus Emotion Median Category
1 Bonobo and human All 0.50 (Intercept)
2 Bonobo All 0.52 (Species)
89% CI pd
0.46 – 0.53 0.58 0.48 – 0.55 0.82
0.44 – 0.51 0.90
Human All 0.47
Sex 0.40
Yawn 0.50
0.36 – 0.43 1.00
0.46 – 0.54 0.55
97
