
Page 40 - Emotions through the eyes of our closest living relatives- Exploring attentional and behavioral mechanisms
P. 40
Chapter 2
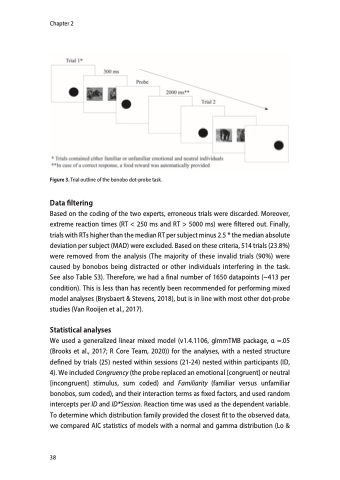
Figure 3. Trial outline of the bonobo dot-probe task.
Data filtering
Based on the coding of the two experts, erroneous trials were discarded. Moreover, extreme reaction times (RT < 250 ms and RT > 5000 ms) were filtered out. Finally, trials with RTs higher than the median RT per subject minus 2.5 * the median absolute deviation per subject (MAD) were excluded. Based on these criteria, 514 trials (23.8%) were removed from the analysis (The majority of these invalid trials (90%) were caused by bonobos being distracted or other individuals interfering in the task. See also Table S3). Therefore, we had a final number of 1650 datapoints (~413 per condition). This is less than has recently been recommended for performing mixed model analyses (Brysbaert & Stevens, 2018), but is in line with most other dot-probe studies (Van Rooijen et al., 2017).
Statistical analyses
We used a generalized linear mixed model (v1.4.1106, glmmTMB package, α =.05 (Brooks et al., 2017; R Core Team, 2020)) for the analyses, with a nested structure defined by trials (25) nested within sessions (21-24) nested within participants (ID, 4). We included Congruency (the probe replaced an emotional [congruent] or neutral [incongruent] stimulus, sum coded) and Familiarity (familiar versus unfamiliar bonobos, sum coded), and their interaction terms as fixed factors, and used random intercepts per ID and ID*Session. Reaction time was used as the dependent variable. To determine which distribution family provided the closest fit to the observed data, we compared AIC statistics of models with a normal and gamma distribution (Lo &
38
