
Page 170 - Emotions through the eyes of our closest living relatives- Exploring attentional and behavioral mechanisms
P. 170
Chapter 7
with individuals receiving congruent trials first having a higher D-score on average (M = .31, SD = .64) than individuals receiving incongruent trials first (M = .04, SD = .58, supplemental Figure S6 and Table 3). Finally, we did not find an effect of Location on D-score averages (p = .194, Table 3).
Results of the WIAT indicate a significantly positive D-score average of .22 (95% CI [.13, .31], t(138) = 4.91, p < .001, Cohen’s d = .42), similar to what the PIAT showed (Figure 4). In the linear model this finding held up (D-score: .22, 95% CI [.13, .31], t(136) = 4.88, p < .001). However, there was no Congruency effect (p = .269), nor an effect of Location (p = .409, supplemental Figure S6, Table 3).
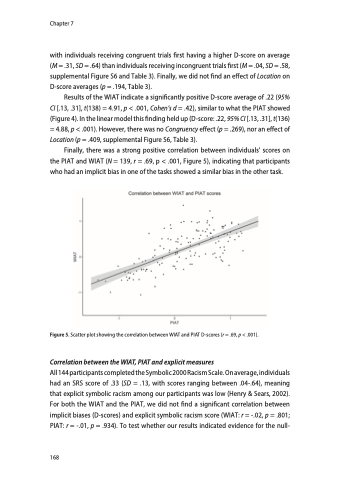
Finally, there was a strong positive correlation between individuals’ scores on the PIAT and WIAT (N = 139, r = .69, p < .001, Figure 5), indicating that participants who had an implicit bias in one of the tasks showed a similar bias in the other task.
Figure 5. Scatter plot showing the correlation between WIAT and PIAT D-scores (r = .69, p < .001).
Correlation between the WIAT, PIAT and explicit measures
All 144 participants completed the Symbolic 2000 Racism Scale. On average, individuals had an SRS score of .33 (SD = .13, with scores ranging between .04-.64), meaning that explicit symbolic racism among our participants was low (Henry & Sears, 2002). For both the WIAT and the PIAT, we did not find a significant correlation between implicit biases (D-scores) and explicit symbolic racism score (WIAT: r = -.02, p = .801; PIAT: r = -.01, p = .934). To test whether our results indicated evidence for the null-
168
